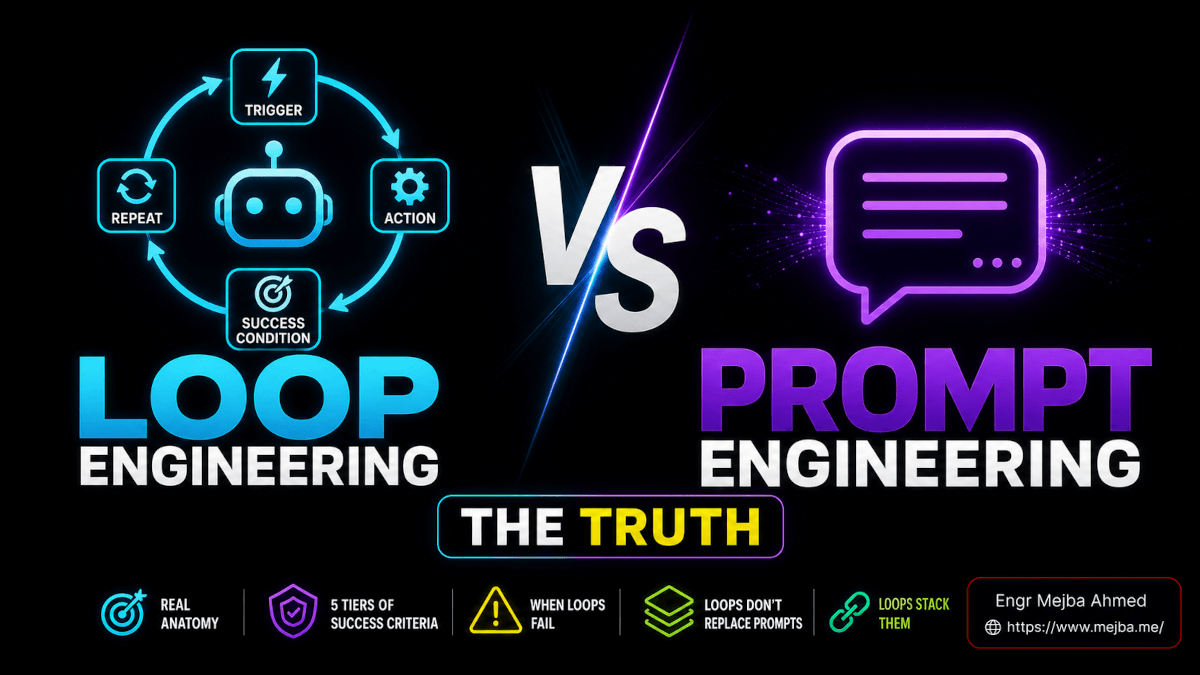

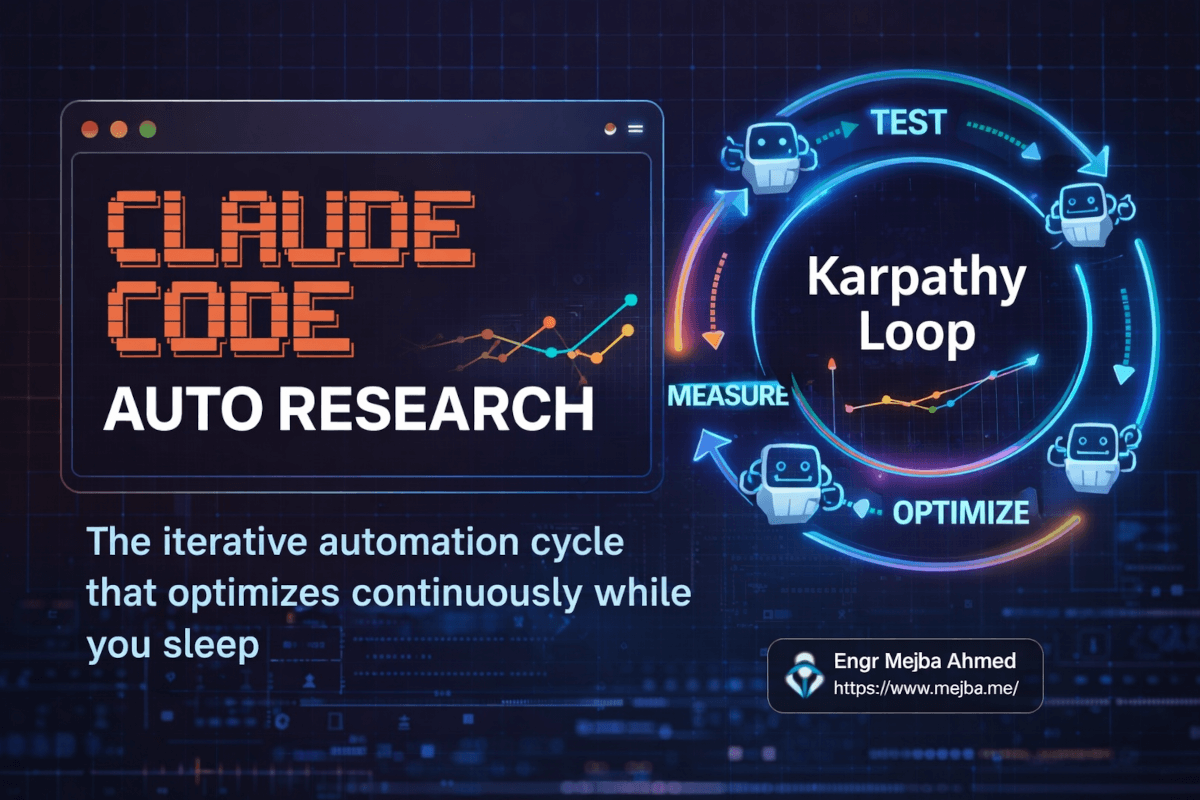
Auto Research Claude Code Karpathy: The Loop That Runs While You Sleep
Andrej Karpathy pushed a 630-line Python script to GitHub on March 7, 2026. He went to bed. When he woke up, his AI agent had run over 100 machine learning experiments, discovered 20 optimizations that actually worked, and compiled the results into a clean log — all without a single human keystroke overnight.
The repo hit 25,000 stars within five days. Shopify's CEO Tobi Lutke pointed it at their templating engine and got 53% faster rendering from 93 automated commits. And suddenly, a concept that had been floating around AI research circles — the autonomous improvement loop — had a name everyone could remember: auto research.
I've been watching this unfold from my Claude Code terminal. And the thing that excites me isn't the ML experiments. It's what happens when you take the same pattern — change one thing, measure the result, keep or discard, repeat — and point it at business problems. Landing page conversions. Email subject lines. Ad copy. Pricing page layouts. Anything with a number attached to it.
That's the version Jack Roberts recently broke down in a detailed walkthrough, and it's the version I've been testing for the past two weeks. The results aren't as dramatic as Karpathy's — I'm not training language models overnight. But I am watching Claude autonomously improve my conversion copy through a structured loop that runs weekly without me touching it. And the compound math on that is genuinely startling.
Here's how the whole system works, how I set mine up, and the specific mistakes I made so you don't repeat them.
The Mental Model: Why 1% Compounds Into 37x
Before touching any code, you need to internalize why this approach works — because the instinct most people have is wrong.
Most optimization happens in bursts. You redesign a landing page every six months. You rewrite email sequences once a quarter. You update ad copy when performance craters. Between those bursts? Nothing changes. You're running the same copy, the same layout, the same headlines for weeks or months at a time.
Auto research flips that model. Instead of big infrequent changes, you make small continuous ones. And the math on continuous improvement is counterintuitive.
A 1% daily improvement — compounded over a year — doesn't give you a 365% gain. It gives you a 37x gain. That's 1.01 raised to the 365th power. James Clear popularized this in Atomic Habits, but Karpathy turned it into an engineering pattern. The auto research loop is the mechanism that makes compound improvement mechanical rather than aspirational.
The inverse is equally brutal. A 1% daily decline compounds to a 97% loss. Stagnation isn't neutral — it's slow erosion as competitors iterate around you.
Now, the 37x number is theoretical. You won't sustain 1% daily improvements on any single metric forever. Diminishing returns are real. But the pattern of continuous automated iteration? That's the unlock. Even a 0.1% average improvement per iteration, running twice a week, produces meaningful gains over a quarter. And the critical part: the AI handles the iteration, not you.
The WD-40 story captures this perfectly. The product got its name because it took 40 attempts to get the water displacement formula right. Forty iterations. Most people would have stopped at five. Auto research removes the human tendency to quit early by making each iteration nearly free.
That's the theory. Here's what the actual system looks like.
Three Components, One Loop: The Auto Research Architecture
The auto research framework — whether you're applying it to ML training like Karpathy or to business metrics like I am — always reduces to three components:
One thing to change. A single variable or element you're willing to let Claude modify. A headline. A CTA button's copy. An email subject line. A pricing page's benefit order. Not five things at once — one thing. Isolation matters because if you change three variables and performance improves, you don't know which change caused it.
One metric to measure. An objective, quantitative number that tells you whether the change helped or hurt. Conversion rate. Click-through rate. Bounce rate. Open rate. Not "vibes." Not "feels better." A number.
A method to read the results. A way for Claude to actually access the performance data without you manually copying it into a prompt. This is where most people get stuck, and I'll show you the workaround I found in the implementation section.
The loop itself is dead simple:
1. Claude reads current performance data (the "control")
2. Claude generates a variant (the "challenger")
3. You deploy the challenger
4. Wait for data to accumulate
5. Claude reads the new performance data
6. If challenger > control → challenger becomes the new baseline
7. If control > challenger → revert, try a different approach
8. Repeat from step 1
This is A/B testing logic, but with the AI handling steps 1, 2, 5, 6, 7, and 8 autonomously. Your job shrinks to step 3 (deploying the change) and step 4 (waiting). And with the right tooling — Claude Co-work's browser automation, for example — even deployment can be automated.
Karpathy's original repo implements this for ML training. His three files map directly to this framework:
prepare.py— Fixed data preparation and utilities. The agent never touches this. It's the stable foundation.train.py— The single file the agent edits. Contains the model architecture, hyperparameters, optimizer, and training loop. Everything is fair game for modification.program.md— The instructions file. Tells the agent what to optimize, how to measure success, and what constraints to respect.
The agent modifies train.py, runs a 5-minute training cycle, checks whether the validation loss improved, keeps or discards the change, and loops. In two days, Karpathy's agent ran 700 experiments and found 20 genuine optimizations. When those 20 tweaks were applied to a larger model, training speed improved by 11%.
The business version follows the same structure — different files, same pattern. Let me walk through how I adapted it.
Setting Up Your Auto Research Environment
I'm going to describe the setup I actually use, not a theoretical ideal. Some of this is scrappy. It works.
Step 1: Define Your Metric and Create a Business Context File
Pick one metric. I chose the click-through rate on a landing page CTA button because the feedback loop is fast (I get enough traffic for weekly reads) and the variable is isolated (button copy and surrounding context).
Then create a business.md file that gives Claude the context it needs to make intelligent decisions. This is the part most people skip, and it's the part that matters most. Without business context, Claude generates generic marketing copy. With it, Claude generates copy that actually fits your audience.
Here's a stripped-down version of mine:
# Business Context

## Who We Are
Ramlit Limited — software development agency serving B2B clients.
Primary service: custom web application development.
Average project size: $15K-$50K.

## Target Audience
- CTOs and engineering leads at mid-size companies (50-500 employees)
- Evaluating build-vs-buy for internal tools
- Pain points: slow development cycles, technical debt, unreliable freelancers

## Current Landing Page Performance
- Monthly visitors: ~2,400
- Current CTA click-through rate: 3.2%
- Primary CTA: "Get a Free Quote"
- Traffic sources: 60% organic, 25% referral, 15% direct

## Brand Voice
Professional but direct. No buzzwords. Results-focused.
Reference tone: ramlit.com existing copy.

## Constraints
- Do not change the core value proposition
- Do not use urgency tactics ("limited time", "act now")
- Keep CTA under 6 words
- All changes must maintain professional tone
The more specific your context file, the smarter Claude's suggestions become. I learned this from my self-improving AI systems work — the quality of the context document directly determines the quality of the AI's output. Generic context produces generic results.
Step 2: Set Up Your Data Pipeline
This is where it gets real — and where most auto research setups break down.
Karpathy's version has it easy. The metric (validation loss) is computed by the training script itself. The agent runs the script, reads the output, and knows immediately whether performance improved. Clean, contained, no external dependencies.
Business metrics aren't that neat. Your conversion data lives in Google Analytics. Or Stripe. Or a platform dashboard that doesn't have an API. Getting that data into a format Claude can read is the first real engineering challenge.
I tested three approaches:
Option A: Direct API integration. If your analytics platform has an API (Google Analytics 4, Mixpanel, Amplitude), you can write a script that pulls the relevant metric and dumps it into a file Claude can read. This is the cleanest approach but requires some setup.
# Example: Pull GA4 data into a metrics file
from google.analytics.data_v1beta import BetaAnalyticsDataClient
from google.analytics.data_v1beta.types import RunReportRequest
import json
from datetime import datetime

client = BetaAnalyticsDataClient()

request = RunReportRequest(
    property=f"properties/YOUR_PROPERTY_ID",
    dimensions=[{"name": "pagePath"}],
    metrics=[
        {"name": "screenPageViews"},
        {"name": "conversions"},
    ],
    date_ranges=[{"start_date": "7daysAgo", "end_date": "today"}],
)

response = client.run_report(request)

# Format for Claude consumption
metrics = {
    "date_pulled": datetime.now().isoformat(),
    "period": "last_7_days",
    "landing_page": "/services",
    "pageviews": int(response.rows[0].metric_values[0].value),
    "conversions": int(response.rows[0].metric_values[1].value),
    "conversion_rate": round(
        int(response.rows[0].metric_values[1].value)
        / int(response.rows[0].metric_values[0].value) * 100, 2
    )
}

with open("metrics/current_performance.json", "w") as f:
    json.dump(metrics, f, indent=2)
Option B: Browser automation with Claude Co-work. When APIs aren't available — and for a surprising number of platforms, they aren't — Claude Co-work can scrape dashboard data directly. I covered this in my Claude Co-work scheduled tasks post. You set up a scheduled task that opens your analytics dashboard, reads the relevant numbers, and writes them to a file or Notion page.
Option C: Manual-assisted (the honest version). For my first two weeks, I just copied the numbers into a metrics.json file every Monday morning. Took 90 seconds. Not glamorous. But it let me validate the loop itself before investing time in automation. Don't let perfect infrastructure prevent you from starting.
I started with Option C, moved to Option B after the first month when I confirmed the loop was producing real gains. If you're just starting, do the same. Automate the data pipeline after you've proven the optimization loop works.
Step 3: Create Your Program File
This is your program.md — the instruction set that tells Claude how to run the loop. Here's the structure I use:
# Auto Research: Landing Page CTA Optimization

## Objective
Improve the click-through rate on the /services landing page CTA.

## Current Baseline
- Control CTA: "Get a Free Quote"
- Control CTR: 3.2% (last 7 days, from metrics/current_performance.json)

## Rules
1. Read the current metrics from metrics/current_performance.json
2. Read the business context from business.md
3. Analyze why the current CTR might be underperforming
4. Generate ONE challenger variant — a new CTA copy and 2-3 sentences
   of surrounding context
5. Explain WHY you expect the challenger to outperform (hypothesis)
6. Write the challenger to variants/challenger_[date].md
7. After deployment and data collection, compare challenger vs control
8. If challenger wins: update baseline in this file
9. If control wins: log the failed hypothesis and try a different approach

## Change Constraints
- CTA must be under 6 words
- Surrounding copy changes limited to the 3 sentences nearest the CTA
- No urgency language, no discount offers
- Maintain professional B2B tone

## Experiment Log
| Date | Variant | Hypothesis | Result | CTR |
|------|---------|-----------|--------|-----|
| Baseline | "Get a Free Quote" | — | Control | 3.2% |
The experiment log at the bottom is critical. It gives Claude memory across iterations. Without it, the agent might suggest the same change twice or fail to learn from previous failures. Each time the loop runs, Claude reads the log, sees what's been tried, what worked, and what didn't — then generates a variant that builds on that accumulated knowledge.
Step 4: Configure the Loop Frequency
How often should the loop run? It depends on your traffic and feedback speed.
For my landing page with ~2,400 monthly visitors, weekly iterations give me enough data to measure meaningful differences. High-traffic sites (10K+ daily visitors) could run daily. Email campaigns might run per-send.
The key constraint: you need enough data between iterations to distinguish signal from noise. If you're testing a CTA change and only 50 people see it before the next iteration, your data is meaningless. Wait for statistical significance — or at least practical significance.
I set mine up as a weekly Claude Co-work scheduled task. Every Monday at 8 AM, Claude reads the latest metrics, compares against the previous week's control, and generates the next challenger if the data is conclusive.
If you're curious about the scheduling mechanics, I walk through the exact Claude Co-work configuration in my scheduled tasks automation guide. The short version: you create a scheduled task in the Co-work panel, point it at your project directory, and set the recurrence.
What Actually Happened When I Ran This for Two Weeks
Here's where I stop talking about theory and show you reality. Including the embarrassing parts.
Week 1: The Baseline
Starting metrics: 3.2% CTR on "Get a Free Quote." 587 pageviews. 19 CTA clicks.
Claude read the business context, analyzed the baseline, and generated its first challenger:
Challenger CTA: "See What We'd Build For You" Hypothesis: The current CTA implies a transactional sales interaction ("quote"). The target audience (CTOs, engineering leads) is in evaluation mode, not purchasing mode. Reframing the CTA as an invitation to see a tailored solution reduces perceived commitment and increases curiosity.
I swapped the CTA copy on Monday afternoon. Took two minutes in the CMS.
Week 1 Results: 612 pageviews. 27 clicks. 4.4% CTR. A 37.5% improvement over baseline.
My immediate reaction was suspicion. A 37.5% lift from changing five words? That felt too high. Could be noise. Could be a different traffic mix that week. I noted it and moved on.
Week 2: The Overconfident Challenger
Claude read the Week 1 results, noted the improvement, and got — I'm going to anthropomorphize here — ambitious. The next suggestion:
Challenger CTA: "Your Custom Build Starts Here" Hypothesis: Building on the success of personalization framing ("What We'd Build For You"), this variant adds forward momentum ("Starts Here") while maintaining low commitment. The possessive "Your" increases ownership psychology.
Reasonable hypothesis. I deployed it.
Week 2 Results: 591 pageviews. 22 clicks. 3.7% CTR. Better than the original baseline, but worse than Week 1's challenger.
So Claude reverted to the Week 1 winner ("See What We'd Build For You") as the new baseline, logged the failed experiment, and noted in the experiment log: "Possessive framing + action language underperformed curiosity framing. Next iteration should explore variations of the curiosity approach rather than shifting to action language."
That note — that self-correcting analysis — is the thing that makes auto research different from a human doing A/B tests. I wouldn't have written that synthesis. I would have looked at the number, thought "that didn't work," and moved on without extracting the lesson. Claude systematically captures why something failed and uses it to inform the next attempt.
The Running Results After Two Weeks:
| Week | CTA | CTR | vs. Baseline |
|---|---|---|---|
| 0 (Control) | "Get a Free Quote" | 3.2% | — |
| 1 | "See What We'd Build For You" | 4.4% | +37.5% |
| 2 | "Your Custom Build Starts Here" | 3.7% | +15.6% |
| 3 (current) | "See What We'd Build For You" (reverted) | Running | — |
Two iterations. One winner, one loser. The system learned from both. And my new baseline is 37.5% above where I started. Now imagine this running for 26 weeks — half a year — with the compound effect of each winning variant becoming the new floor.
That's auto research.
The Karpathy Repo: Translating ML Experiments to Business Use
Let me bridge the gap between what Karpathy built and what you'll actually use, because the implementations look different even though the pattern is identical.
Karpathy's autoresearch repo is focused on neural network training optimization. The agent modifies architecture decisions, hyperparameters, optimizer configurations — technical choices that affect a single metric: validation loss. The entire feedback loop is self-contained. train.py runs for 5 minutes, outputs a loss value, and the agent decides whether to keep the change.
The repo blew up (49,800+ GitHub stars as of this writing) because it demonstrated something people had theorized about but hadn't seen work cleanly: an AI agent that genuinely improves a system through autonomous experimentation, not just prompting.
But unless you're training neural networks, you need to adapt the pattern. Here's the translation table:
| Karpathy's ML Version | Your Business Version |
|---|---|
train.py (model code) |
Your landing page / email / ad copy |
prepare.py (data utilities) |
Your analytics pipeline (API or scraping) |
program.md (agent instructions) |
Your program.md (optimization goal + constraints) |
| Validation loss | Conversion rate / CTR / open rate |
| 5-minute training run | 1-week traffic accumulation |
| Automatic code execution | Manual deployment or Claude Co-work automation |
| GPU compute | Human patience |
The biggest difference: speed. Karpathy's agent ran 700 experiments in 2 days because each experiment took minutes. Business optimization loops run weekly or daily because you need real humans to generate the data. This means your experiment log becomes even more important — you can't afford to waste an iteration on a poorly reasoned hypothesis.
Pro tip: Karpathy's repo includes a program.md file that's worth reading even if you never train a model. The way he structures constraints, success criteria, and agent instructions is a masterclass in prompt engineering for autonomous systems. I stole his format directly for my business optimization version.
The Data Problem Nobody Talks About (And My Workaround)
Here's the uncomfortable truth about applying auto research to business metrics: most of your important data lives behind dashboards that weren't designed for programmatic access.
Google Analytics has an API. Stripe has an API. But Skool? ConvertKit's detailed engagement data? Your WordPress dashboard? Your Shopify theme editor? Half the tools founders actually use don't expose the metrics you need through clean APIs.
Jack Roberts highlighted this exact problem in his walkthrough, and his solution is the right one: browser automation.
Claude Co-work's browser capabilities can navigate to a dashboard, read the numbers, and write them to a file. It's not elegant. It's not a proper integration. But it works reliably for the "read the metric" step of the loop.
The setup looks like this:
- Create a Co-work task that navigates to your analytics dashboard
- Log in using saved credentials (or, better, a session that stays authenticated)
- Read the specific metric from the page — Claude can identify and extract numbers from dashboard UIs
- Write the metric to a JSON file or Notion page that your main auto research loop reads
I tested this with a Google Analytics dashboard and a Notion database. Claude Co-work opened the GA page, found the conversion rate for my target page, extracted the number, and wrote it to a Notion table. Took about 45 seconds per run. Not fast, but for a weekly cadence? Fine.
For platforms that require more complex navigation — multiple clicks, dropdown filters, date range selections — you'll need to be more explicit in your Co-work task instructions. Describe each click. Specify which element to interact with. The more precise your instructions, the more reliable the automation.
One alternative worth mentioning: Google Sheets as a middle layer. You can set up a Google Sheet that imports data from various sources (using built-in connectors, Zapier, or manual entry), and then have Claude read the sheet via the Google Sheets API. It's a universal adapter. Messy, but universally compatible.
Choosing the Right Metric: Where Auto Research Works (and Where It Doesn't)
Not every metric is a good candidate for auto research. I learned this by trying to optimize the wrong thing first.
High-value candidates:
- Landing page conversion rates — Fast feedback, clear metric, isolated variable. My top recommendation for your first auto research loop.
- Email subject line open rates — Each send is a new experiment. High data volume if your list is 1,000+.
- Ad copy click-through rates — Platforms like Google Ads and Meta already provide the metric. You just need Claude to generate variants and read results.
- Checkout page completion rates — High business impact, measurable, and small copy/layout changes can move the needle significantly.
- Feature adoption rates in SaaS — If you can measure how many users activate a feature, you can optimize the onboarding copy or UI that leads to it.
Low-value candidates (avoid these for auto research):
- SEO rankings — Feedback cycle is too slow (weeks to months). Too many confounding variables. You can't isolate what caused a ranking change.
- Brand awareness — Not quantifiable in a meaningful way for iteration loops.
- NPS scores — Too subjective and too infrequent for rapid iteration.
- Revenue — Too high-level. Revenue is an output of many inputs. Optimize the inputs individually.
- Social media engagement — Too noisy. Algorithm changes, viral randomness, and audience mood all confound the data.
The ideal auto research metric has four properties:
- High volume — Enough events per cycle to measure differences
- Fast feedback — Results available within days, not months
- Isolated variable — You can change one thing and measure the impact
- Accessible data — You can read the metric programmatically (or via browser automation)
If your chosen metric doesn't meet all four criteria, pick a different one. The loop only works if the data is clean, fast, and attributable.
The Quality of Questions Matters More Than the Quality of Answers
This is something Jack Roberts emphasized that deserves its own section, because it's the most underrated insight in the entire auto research framework.
When you write your program.md, you're not just giving Claude instructions. You're defining the problem space. And the quality of that problem definition determines the ceiling of what Claude can discover.
Bad problem definition:
"Improve our website conversion rate."
Good problem definition:
"Improve the click-through rate on the /services page CTA. The target audience is CTOs evaluating build-vs-buy decisions. Current CTR is 3.2% with 600 weekly pageviews. The CTA appears below a benefits section and above a testimonial block. Traffic is 60% organic search."
The difference? The second version gives Claude enough context to form intelligent hypotheses. It knows the audience's mindset. It knows the page structure. It knows the traffic source, which hints at search intent. Every one of those details shapes the suggestions Claude generates.
I've found that spending 30 minutes writing a thorough business.md and program.md produces better results over 10 iterations than spending 5 minutes on a vague brief and running 50 iterations. Context is leverage.
This connects to a broader principle I've seen across all my Claude Code work: the bottleneck is almost never the AI's capability. It's the human's ability to define the problem precisely. Auto research amplifies whatever signal you give it — so if the signal is vague, you get vague optimization. If the signal is precise, you get precise gains.
Scaling Beyond a Single Metric: The Multi-Loop Architecture
Once your first auto research loop is working and producing gains, the natural question is: can I run multiple loops simultaneously?
Yes. But carefully.
The risk with multiple simultaneous optimization loops is interaction effects. If you're optimizing your landing page CTA and your hero headline and your testimonial section all at the same time, a change in one might affect the performance of another. Your CTA improvement might look like a regression because the headline change above it shifted user attention.
My approach: sequential, not parallel.
Run one loop until it stabilizes (meaning the improvements plateau and challengers stop beating the control consistently). Then lock that variable, set the winning version as permanent, and start a new loop on the next variable.
For my landing page, the sequence looks like:
- CTA copy (running now)
- Hero headline (next)
- Social proof section (after headline stabilizes)
- Benefits block ordering (last)
Each loop runs for 4-8 weeks before I move to the next variable. Patient? Yes. But it preserves the causal clarity that makes the data trustworthy.
If you absolutely need to run parallel loops, do it on different pages or different channels. Optimize your landing page CTA and your email subject lines simultaneously — those are independent systems with independent metrics. Just don't optimize two elements on the same page at the same time.
What Most People Will Get Wrong
I've been testing this for two weeks and talking to three other builders who are doing the same. Here are the patterns I see failing:
Changing too many variables per iteration. The temptation to "make it better" by changing five things at once is strong. Resist it. You need isolation to learn what works. One change. One measurement. One decision.
Ignoring statistical significance. If 50 people saw your new CTA and 3 clicked it (6% CTR) vs. 2 clicking the old one (4% CTR), that's not a meaningful difference. You need enough data volume per iteration to trust the result. For small-traffic sites, this means longer iteration cycles — weekly at minimum, biweekly for very low traffic.
Using subjective metrics. "The page feels better" is not a metric. "The new copy is more on-brand" is not a metric. The auto research loop requires a number. If you can't express your goal as a number, the loop can't optimize for it.
Skipping the business context. Running auto research without a business.md file is like hiring a copywriter and not telling them who your customers are. Claude will generate something. It won't generate anything particularly useful.
Giving up after the first failed iteration. The Week 2 challenger in my test performed worse than Week 1's winner. If I'd stopped there, I'd have missed the learning that informed Week 3's approach. Failed experiments aren't failures — they're data points that narrow the search space for the next iteration. Karpathy's agent ran 700 experiments. Many of them made things worse. That's the process.
The Bigger Picture: Why This Changes How I Think About Optimization
Before auto research, my optimization process looked like this: have an idea, implement it, check results in two weeks, forget to check, check a month later, can't remember what I changed, start over.
After auto research, my optimization process looks like this: define the metric, define the constraints, let Claude run the loop, review the experiment log weekly, intervene only when something looks off.
The cognitive load difference is enormous. I'm not spending mental energy on "what should I test next?" That's Claude's job. I'm spending mental energy on "is the framework correctly defined?" — which is a much more leveraged question.
And the compound effect is real. Not the theoretical 37x. But a 37.5% improvement in two weeks on a single metric, with a system that will keep iterating? Project that forward six months. Even with diminishing returns, the cumulative impact on a business metric that matters — conversions, clicks, sign-ups — is significant.
The auto research pattern isn't complicated. Three files. One metric. One loop. The hard part isn't building it. The hard part is picking the right metric, writing precise context, and being patient enough to let the compound effect work.
Karpathy showed this works for ML research at a scale that stunned the industry. The business version is slower, messier, and less dramatic. It's also accessible to anyone with a Claude subscription and a metric they care about.
Start with one metric. Write your context file tonight. Set up the loop this weekend. Then let it run while you sleep.
Six months from now, you'll either wish you'd started today — or you'll be glad you did.
Auto Research Claude Code Karpathy: Common Questions
What is auto research in Claude Code?
Auto research is an autonomous optimization loop where Claude Code iteratively tests changes against a measurable metric, keeps improvements, discards failures, and repeats. Andrej Karpathy popularized the pattern in March 2026 with his autoresearch GitHub repo, which ran 700 ML experiments in two days. For business applications, the same pattern optimizes conversion rates, click-through rates, and other quantifiable metrics.
Do I need coding experience to set up an auto research loop?
Basic file management and comfort with a text editor are enough for a manual-assisted setup where you copy metrics into a JSON file weekly. For full automation — API integrations, browser scraping, scheduled tasks — you'll need intermediate Python skills or familiarity with Claude Co-work's browser automation features. The program.md and business.md files are plain Markdown.
How much traffic do I need for auto research to work?
You need enough events per iteration cycle to distinguish signal from noise. For landing page optimization with weekly cycles, 500+ pageviews per week is a reasonable minimum. Email optimization needs 1,000+ recipients per send. Ad copy testing works with smaller volumes because ad platforms provide robust measurement. Low-traffic sites should use biweekly or monthly cycles instead.
Can I run auto research on multiple metrics at once?
Run parallel loops on independent systems — optimize your landing page and your email subject lines simultaneously. Avoid running parallel loops on the same page or funnel, because changes to one element can affect the performance of another, making it impossible to attribute results. Sequential optimization with one variable at a time produces cleaner, more trustworthy data.
How does Karpathy's autoresearch repo relate to business optimization?
Karpathy's repo optimizes neural network training by letting an AI agent modify train.py, run a training cycle, measure validation loss, and keep or discard changes. The business version uses the same control-vs-challenger pattern but swaps ML training for business copy, validation loss for conversion rate, and 5-minute training runs for weekly data collection. The core framework — change, measure, decide, repeat — is identical.
Whether the Karpathy Loop Fits Your Work
An auto-research loop that runs 100-plus experiments overnight and compiles results by morning works because 1% improvements compound — 37x over a year, as the math goes. The unlock isn't any single run; it's letting the loop grind while you sleep.
Set up one small overnight loop on a real question before you scale it. My self-improving Claude skills and Karpathy Software 3.0 piece go deeper.
If you want an automated research loop built for your work, that's something I do through Ramlit.