
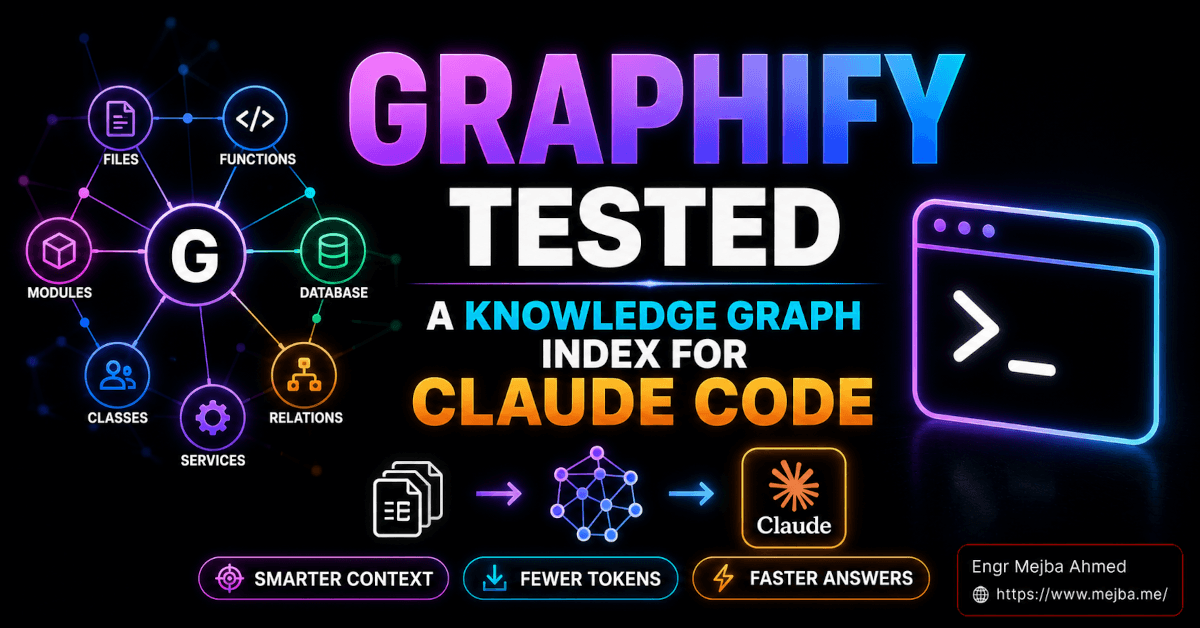

I almost dismissed Graphify as another npx-flavored toy. The pitch sounded too clean: point it at any folder, get a knowledge graph, query the graph instead of re-reading files, watch your token usage collapse. I have a healthy reflex about anything promising an order-of-magnitude cost cut in one command — the math usually holds for the demo and dies on a real codebase. Then I ran it on an agency repo I had been losing arguments with for a month — seven app modules, tangled shared services — and the graph showed me a circular dependency between billing logic and a notification service that should never have known about each other. I had missed it for half a year.
That was the moment I stopped treating Graphify as a token-savings trick and started treating it as a code review tool that happens to also save tokens. The skill has lived in my ~/.claude/skills/ directory ever since. Here is what I learned running it on real codebases: what it does, where the token math is honest, where it is marketing, and which workflows it actually changed.
The tax it eliminates
The workflow most Claude Code users are stuck in: you open an unfamiliar repo, ask "which services touch the billing module?", and Claude starts reading files. The file you mentioned, then its imports, then their imports. Twenty tool calls later you have an answer and a context window 70% full before you have written a line. That is the exploration tax, and you pay it again every session, because the codebase did not change between Tuesday and Thursday but your agent re-reads it from scratch anyway. I have burned through multi-million-token days on exactly this pattern, which is why token management became its own discipline for me.
Grep and embeddings chip at the problem without solving it. Grep finds strings, not concepts. Embeddings find text that resembles your query, not the structural relationships your code has. Neither answers "which functions does RateLimiter end up calling, three hops deep?" — because that answer is not in any single file. It lives in the graph between files.
Graphify's bet: build that graph once, store it next to the repo, and let the agent query the graph instead of crawling source. The graph is a couple of megabytes of JSON; the agent reaches for raw files only when it needs to actually edit code.
How the graph gets built
Two extraction paths, and the split matters. For code, Graphify uses tree-sitter to parse source into ASTs and pull structural relationships — calls, imports, inheritance — deterministically, without sending a token to any LLM. Fast, free, exact. For docs, markdown, and PDFs, it uses an LLM of your choice to extract entities and infer relationships. That costs tokens once, at build time, and amortizes across weeks of queries.
Then it runs Leiden community detection over the combined graph — clustering that asks "which parts of this graph hang out together?" The output is your repo's natural module structure derived from how the code actually connects, not from how your folders are organized. Sometimes those agree. When they violently disagree, that disagreement is the most useful signal in the whole build. My billing/notification loop showed up precisely because the clustering put two "unrelated" folders in one community.
The catch, stated up front: graph queries are great for reading a codebase and useless for writing to it. Graphify replaces your exploration of the source folder, not the source folder.
Install and skill registration
The repo is Graphify-Labs/graphify on GitHub. One quirk worth knowing: the PyPI package is graphifyy — double y — while the CLI command stays graphify. Other graphify* packages on PyPI are unaffiliated. Python 3.10+ required.
uv tool install graphifyy   # or: pipx install graphifyy
graphify --version
graphify install
graphify install is the step that makes this useful inside your agent rather than beside it. It writes the skill manifest into ~/.claude/skills/graphify/, updates your project CLAUDE.md so the assistant reaches for graphify query before falling back to raw file reads, and registers the slash commands. The sanity check: open Claude Code, type /, and look for the graphify commands in the picker. If they are missing, check that ~/.claude/skills/graphify/SKILL.md exists — that is the file Claude Code discovers on startup. I can vouch for this mechanism because that exact file sits on my machine; it is the same skill-loading pattern I lean on across my daily slash-command workflow. The installer also auto-detects Codex, Cursor, OpenCode, and a dozen other assistants if you run a mixed stack.
Building and querying
From inside the repo:
graphify build --mode deep
Defaults work, but four flags do most of my real work: --mode deep for a more aggressive semantic pass over docs (more conceptual edges, more upfront tokens); --update for incremental rebuilds — it re-extracts only files whose SHA256 content hash changed, so renames don't trigger re-extraction, and it is the flag you will use 95% of the time; --cluster-only to rerun Leiden without re-extracting; and --no-viz when you only need the JSON for an agent.
On my agency repo, the first deep build took under three minutes, with LLM spend well under a dollar because tree-sitter did the structural bulk for free. Incremental updates after small commits finish in seconds.
The output directory has three files that matter. graph.html is the interactive visualization — the file you show your team, and the one where I literally saw my dependency loop drawn on screen. graph.json is the machine-readable graph your agent queries; this is where the token savings live. GRAPH_REPORT.md is a plain-English audit: your god nodes (the files that touch everything — usually an architectural smell), unexpected links the LLM noticed, and suggested questions. The first one of these I read felt like a senior engineer's onboarding notes on my own codebase.
Three query commands carry my daily usage:
graphify query "what connects the auth layer to the database?"
graphify path "UserService" "DatabasePool"
graphify explain "RateLimiter"
query returns a subgraph — nodes and typed edges — in a few thousand tokens where raw file reads would cost tens of thousands. path returns the shortest chain of calls and imports between two entities, which is impact analysis for free: before touching a load-bearing function, I check what depends on what. explain is the "what is this thing" command, the first thing I run in any unfamiliar repo.
The honest token math
The marketing number is "71.5x fewer tokens per query." It is real and it is misleading at the same time. The benchmark behind it ran on a mixed corpus — code plus research papers plus images — where multimodal content inflates the raw baseline enormously. On a pure-code repo, which is what you probably have, my experience puts realistic compression at 5x to 10x on structural queries. A fifty-thousand-token exploration becomes five to ten thousand.
That is still real money over a month of API usage. But the savings are not uniform, and this is what I want to be loud about because I keep seeing it oversold:
Where it wins: onboarding into unseen repos, refactor impact analysis, cross-cutting questions ("every place we hit Stripe"), architecture review. Structural understanding, not content reading.
Where it does not help: writing code, modifying functions, debugging a specific error. The graph tells the agent which files to read; it does not replace the read. Graphify is an index over your codebase, and you do not edit an index. Treat it as a silver bullet and you will be confused when your refactor session still burns tokens.
What actually changed in my workflow
First command on a fresh clone is now graphify build --mode deep, then the report, then explain on the three most-connected nodes. Fifteen minutes gets me a better mental model than an hour of grep-driven wandering used to. Client-side, "is this app actually using the library you are paying for?" went from a forty-minute manual review to a five-minute graph query.
Just as important is knowing where I still reach for the old tools. When I know the exact string — an error message, a config key — grep remains faster than any graph query. Graphify earns its keep on questions where I do not yet know the right grep; it is the what should I be searching for tool. And for open-ended reasoning ("is there a better architecture here?"), a planning sub-agent still wins — the graph just hands it smaller, denser starting context. Graph for structure, grep for strings, agents for reasoning: a stack, not competitors. The remaining piece, carrying that context across sessions without re-paying the exploration tax, is what my handoff skill workflow covers.
Where it breaks down
Failure modes I have hit, not theoretical ones. Small repos do not need it — below roughly twenty thousand lines, the build cost outweighs query savings, because the whole thing fits in context anyway. Languages with weak tree-sitter grammars produce thin graphs with missing call edges; mainstream stacks (Python, TypeScript, Go, Rust, Java, PHP) are excellent, exotic ones deserve a test before you rely on it. Doc extraction quality tracks how structured your prose is — clean headings and consistent terminology graph well, stream-of-consciousness wiki dumps graph noisily. And the inferred semantic edges are only as good as the model you configure; there are no published precision-recall numbers for the extraction, so treat inferred edges as suggestions, not ground truth.
Should you install it?
Install it if you use Claude Code, Codex, or Cursor on codebases past ten thousand lines, get dropped into unfamiliar repos, or watch exploration eat your token budget. Skip it if you only work on small projects or expected a magic refactor tool — Graphify does not fix your architecture, it tells you what your architecture is. What you do with that is still on you.
For me it earned a permanent slot: structural index first, raw files only when I sit down to edit. The graph for the repo that opened this post is now committed alongside the source and rebuilt on every PR, and the "what does this codebase even look like" question went from an hour to about ninety seconds. Teams usually call me after a graph shows them something they cannot unsee — a circular dependency, a god node, a library nobody actually imports. Point me at the repo and I will tell you what the graph says about it: start here.