Most Playwright-plus-AI posts are about building bots. That's the wrong frame. After months of running browser automation inside Claude Code on my own Laravel site, the highest-value use isn't a bot at all — it's the verify loop: the agent changes code, opens a real browser, and proves the change works before I ever look at it. The tooling question that actually matters is cheaper than people think and more specific: which transport should Claude use to drive the browser — Playwright CLI, Playwright MCP, or Chrome DevTools MCP? I have all three wired into my setup, and they are not interchangeable.
Here's the token math, the setup, and the production bug that convinced me a real browser run belongs in every UI change.
Playwright CLI vs Playwright MCP: the token math
Microsoft ships two ways for a coding agent to drive Playwright. The MCP server streams page state — accessibility trees, snapshots — back into the model's context on every interaction. The newer Playwright CLI (@playwright/cli on npm, launched in early 2026 as a companion to the MCP server, not a replacement) flips the data flow: it writes snapshots and screenshots to disk, and the agent reads only the piece it needs, when it needs it.
The Playwright team's own benchmark puts a typical automation task at roughly 114,000 tokens through MCP versus about 27,000 through the CLI — call it a 4x reduction. That matches the shape of what I see in my own sessions: the expensive part of MCP-driven browsing is never the clicking, it's the page state riding along in context on every turn. On a long session where the browser is only one of several tools Claude is juggling — file edits, tests, git — that overhead crowds out the actual work. I've written about why that crowding matters in my Claude Code token management guide; browser tooling is one of the biggest line items most people never itemize.
The deeper reason the CLI fits Claude Code well is boring and important: it's a binary you call with arguments. Claude Code is very good at composing small shell commands and reading files. It is less good at reasoning over a 50,000-token accessibility tree it didn't ask for. The CLI plays to the agent's actual strengths.
Getting started takes about two minutes:
# Per-project
npm init playwright@latest
npx playwright install --with-deps

# Or the agent-focused CLI, global
npm install -g @playwright/cli@latest
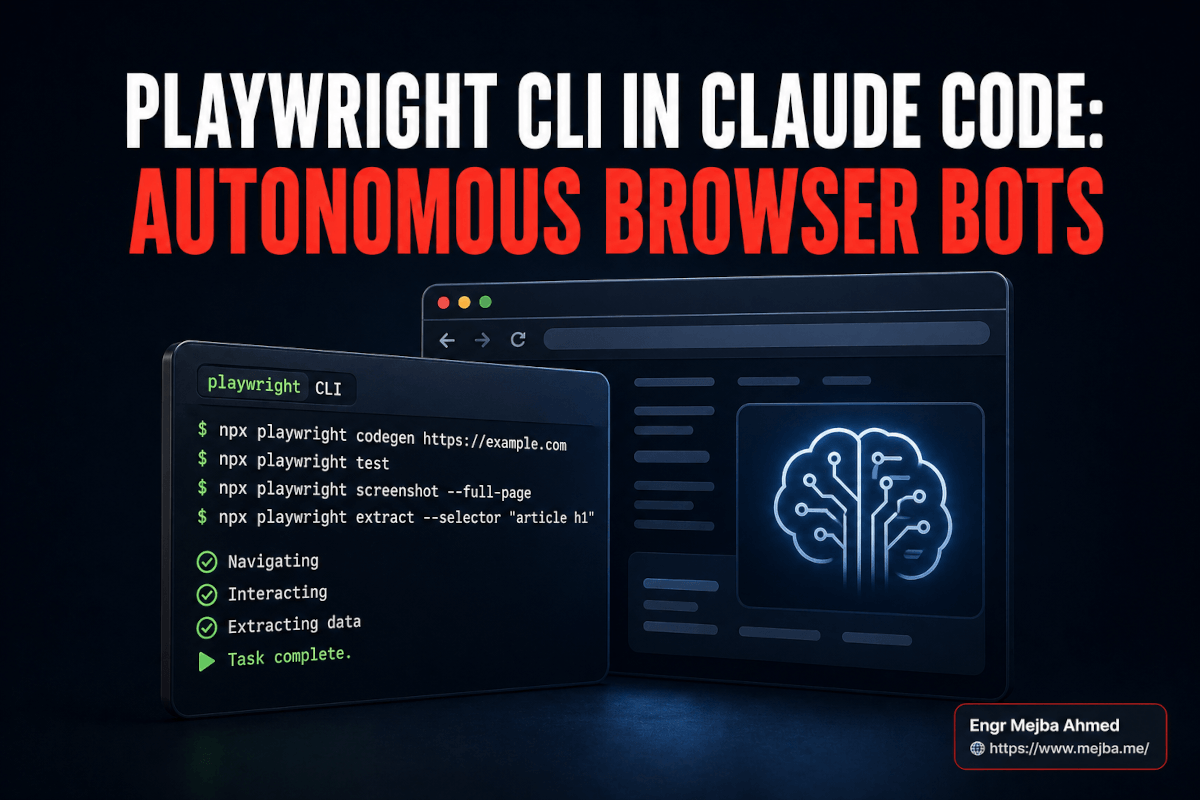
From there the surface Claude actually uses is small: codegen to record a session into a working script, test to run headless, test --headed --debug when you need to watch it, show-trace to autopsy a failure after the fact.
What my repo's .playwright-mcp folder actually looks like
Theory aside, here's what months of this workflow leave behind. The .playwright-mcp/ directory in my mejba.me repo currently holds an ad-audit/ folder of screenshots — about-panel-desktop-dark.png, about-panel-mobile-light.png, about-panel-tablet-dark.png, blog-desktop-dark.png, and a dozen more — plus timestamped console logs from debugging sessions, some a few kilobytes, one 188 KB from a session where an ad script was spraying errors.
Those files are the residue of two real jobs. The first was an AdSense integration audit: I had Claude load the live pages at desktop, tablet, and mobile widths, screenshot each, and read the browser console for errors — because ad units fail silently and differently per viewport, and no amount of reading the Blade templates tells you what actually rendered. The second was iterating on a redesigned About panel in both light and dark themes; the naming (-dark-v2, -dark-v3, -dark-v3b) records the loop: change, screenshot, compare, change again.
My project instructions bake this in as a rule, not a habit: any UI change gets verified in a browser at the local dev URL, and client WordPress work gets checked at desktop, tablet, and mobile widths before I call it done. The agent follows the rule because it's written down. That's the whole trick — browser automation as a standing verification step, not a special project.
The bug that unit tests can't see and a browser run can't miss
This is the part I'd want someone to have told me a year earlier.
My site runs a guest HTML caching middleware: logged-out visitors get pages served with public cache headers so the CDN can absorb traffic. Efficient — and it was silently breaking a lead form in production. Caching a page publicly means stripping the session and XSRF cookies from the response. The lead-gen page carried a form protected by a session-based CAPTCHA. No session cookie, no CAPTCHA state, no successful submission — ever, for any logged-out visitor, which is every visitor who matters on a lead page.
Nothing in the codebase looked wrong. The controller was fine. The form validation was fine. Feature tests passed, because the test client doesn't go through the CDN-facing cache path. The only way this bug was ever going to surface was what eventually surfaced it: an end-to-end run in a real browser as a guest, watching the form fail and then reading the response headers. The fix now lives as an exclusion list in the middleware itself, with a comment explaining why — including a second variant we caught the same way, where locale-prefixed pages like /de/contact were being cached with their cookies stripped while the bare /contact path was correctly excluded, and where blog posts with a Livewire comment form answered 419 Page Expired on every comment round trip.
One repo, three flavors of the same failure class: server-side logic that is only wrong from a real browser's point of view. That's the argument for making the agent's verify loop headed-browser-real, not just test-suite-green. If your Claude Code sessions end at "tests pass," you are shipping this category of bug.
When I reach for each of the three tools
I keep Playwright CLI, the Playwright MCP plugin, and the Chrome DevTools MCP plugin all installed in Claude Code. The split that's held up:
Playwright CLI — scripted, repeatable runs: regression checks, multi-page flows, anything I'll run more than twice. The disk-based snapshots keep long sessions cheap, and failed runs leave traces I can hand back to Claude for diagnosis without re-driving the browser.
Playwright MCP — interactive, exploratory work: "open the page, click around, tell me what's broken." When I don't know what I'm looking for yet, the conversational round trips are worth their token cost. This is what produced most of my .playwright-mcp/ screenshots.
Chrome DevTools MCP — the "why is this slow" tool. Performance traces, network waterfalls, Lighthouse runs, console message history. When the question is speed or resource behavior rather than correctness, CDP-level data is simply richer than what Playwright exposes. I added this plugin specifically for Core Web Vitals work and it earned its place in a week.
The mistake is treating these as competitors. They're transports with different cost profiles. Pick per job, the same way you pick grep versus an IDE search.
Staying logged in across runs
For automation behind a login, the two Playwright primitives people conflate:
storageState snapshots cookies and localStorage to a JSON file — log in once, save state, reuse it across headless runs. Right for CI and for scripts.
launchPersistentContext is a full browser profile on disk — cookies, localStorage, IndexedDB, service workers. First run headed: you log in by hand, complete any 2FA, close the browser. Every later run reuses the same userDataDir headless, already authenticated. Right for anything that needs to look like a returning user over days or weeks.
There's a third option worth knowing: launch Chrome yourself with --remote-debugging-port=9222 and have Claude connect via chromium.connectOverCDP(). That lets you hand-navigate a hostile auth flow — SSO redirects, hardware keys — and then hand the authenticated session to the agent. Chromium-only, and I use it rarely, but nothing else solves that specific problem.
One rule regardless of transport: first run of any new automation is headed, so you can watch the actual mistake happen; stable runs go headless. Debugging a headless failure from a screenshot and your imagination is how twenty-minute fixes become three-hour ones.
Where I don't use browser automation
Three edges I've hit and now route around. Cross-origin iframes — embedded payment flows, social login popups — are automatable in principle and brittle in practice; I verify those by hand or intercept at the network layer. Email-confirmation flows: Playwright will click the link, but fetching the link needs a mailbox API, not a browser. And scheduled unattended runs on a laptop: a cron-driven headless browser dies the first time the machine sleeps. If a check needs to run on a schedule, it runs server-side — the same reasoning behind the scheduled SEO checks I run with Claude Code routines.
For a wider look at how browser access fits into agent workflows beyond Playwright, my note on WebMCP and Chrome-native AI agents covers the protocol side, and the head-to-head where I tested Codex against Claude Code includes how each tool handles browser-based QA.
Start with the verify loop, not the bot
If you're new to this, resist the scraper-and-bot projects for a week. Instead, wire Playwright into Claude Code and add one sentence to your project instructions: "after any UI change, load the affected page in a browser at desktop and mobile widths, screenshot it, and check the console for errors." Then make a UI change and watch what the loop catches. My cookie-stripping bug survived code review, static analysis, and a passing test suite. It did not survive one real browser run.
That's the return on investment: not automation that replaces your QA, but a standing witness that your changes actually work where your users are.
I build and harden this kind of verification pipeline — browser checks, E2E coverage for the flows that make you money, agent workflows that prove their own work — for client projects. If your forms, checkouts, or lead pages have never been exercised by an automated real-browser run, tell me what you're running and I'll tell you where it's likely lying to you.