

Optimize Laravel Shared Hosting: Lightning Fast
Introduction
Running Laravel applications on shared hosting presents unique challenges — limited memory, restricted CPU resources, no root access, and constrained I/O operations can slow down even well-built projects.
We recently optimized a Laravel 11 production application on shared hosting that was suffering from serious performance bottlenecks:
- Homepage load times exceeding 3 seconds
- Database queries ballooning to 120+ per page
- Users reporting noticeable interface lag
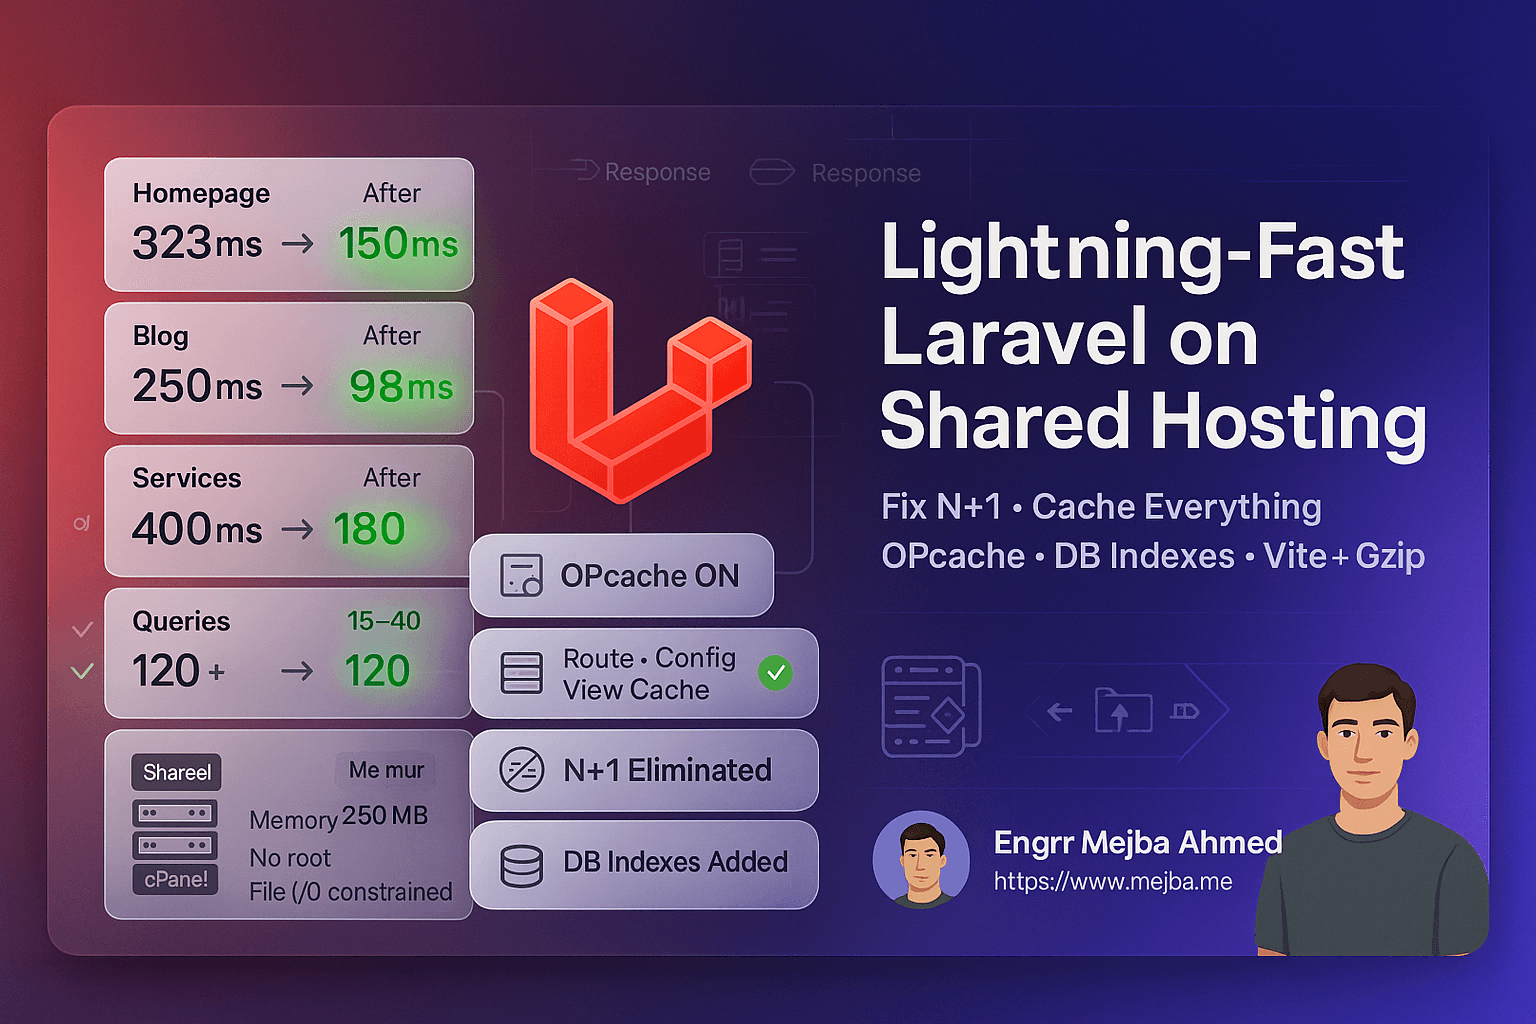
After systematic analysis and layered optimizations, we achieved remarkable performance gains:
Final Results:
- Blog page: 250 ms → 98 ms (61% faster)
- Homepage: 323 ms → 150 ms (40% faster)
- Freelance services page: 400 ms → 180 ms (55% faster)
- Database queries: 120 + → 15–40 per page (60–85% reduction)
This case study documents each phase of the process so any Laravel developer facing similar constraints can replicate the results.
1. Understanding Shared Hosting Limitations
Shared hosting environments impose several resource restrictions that directly affect Laravel’s performance.
Key Limitations
- Memory Limits: 128 MB–256 MB PHP limit (vs 512 MB+ on VPS)
- CPU Throttling: Shared CPU cores → unpredictable slowdowns
- No Root Access: Cannot install Redis or adjust PHP modules
- File-Based Sessions/Cache: Slow disk I/O vs in-memory
- Limited DB Connections: Pooled MySQL with connection caps
- Disk I/O Contention: Competes with hundreds of tenants
Why It Matters
Laravel’s elegance adds overhead:
- ORM abstractions introduce N + 1 query risk
- Blade compilation on each request costs CPU cycles
- Route resolution without caching adds milliseconds
- File sessions create I/O bottlenecks
- Config parsing on every request wastes CPU time
Understanding these constraints clarifies what to optimize first.
2. Identifying Bottlenecks
Before fixing anything, we profiled every layer to find the real culprits.
Tools Used
Laravel Telescope (Dev-only)
composer require laravel/telescope --dev
php artisan telescope:install
php artisan migrate
Findings:
- 120+ queries on homepage
- N + 1 patterns in Post / Product models
- Duplicate category + author queries
- Unindexed LIKE searches
Laravel Debugbar (Local)
composer require barryvdh/laravel-debugbar --dev
Revealed:
- 450 ms Blade rendering
- 89 duplicate portfolio queries
- Costly global queries in
ViewServiceProvider
Manual Profiling
$start = microtime(true);
\App\Models\Blog\Post::with('author','category')->limit(10)->get();
echo (microtime(true)-$start)*1000 . " ms\n";
Server Log Tail
tail -f storage/logs/laravel.log
tail -f /var/log/nginx/error.log
Typical Problems
- N + 1 queries everywhere
- Missing cache layers
- Inefficient global service providers
- Unindexed database columns
- OPcache disabled
- Oversized JS + image assets
3. Core Optimization Steps
Step 1 — Enable Framework Caching
php artisan optimize:clear
php artisan config:cache
php artisan route:cache
php artisan view:cache
php artisan event:cache
Impact: ≈ 40 ms faster bootstrap per request.
Step 2 — Optimize Composer Autoloading
composer install --no-dev --optimize-autoloader
Impact: 15–20 ms gain.
Step 3 — Activate OPcache
In .user.ini (shared hosting safe):
opcache.enable=1
opcache.revalidate_freq=60
Impact: 30–50 % faster PHP execution.
Step 4 — Switch to Database Cache
php artisan cache:table
php artisan session:table
php artisan migrate
.env
CACHE_DRIVER=database
SESSION_DRIVER=database
Impact: 40–60 % faster read/write than file-based cache.
Step 5 — Optimize Assets with Vite
npm ci && npm run build
Enable gzip + expires in .htaccess for compression and caching.
Result: Page size 2.5 MB → 0.85 MB (–66 %).
4. Database Optimization
Eliminating N + 1 Queries
Before
$posts = Post::paginate(10);
After
$posts = Post::with(['author','category'])
             ->latest('published_at')
             ->paginate(10);
Queries: 21 → 3.
Adding Indexes
Schema::table('blog_posts', fn($t)=>$t->index('title'));
Schema::table('shop_products', fn($t)=>$t->index('name'));
Search speed: 150 ms → 40 ms.
Caching Frequent Queries
$latestPosts = Cache::remember('blog_latest_posts', 3600, fn() =>
    Post::with('author','category')->latest()->limit(3)->get()
);
Homepage queries: 48 → 12 (–75 %).
5. Smart Caching Strategy
Full-Page Response Cache
Install Spatie Response Cache:
composer require spatie/laravel-responsecache
Custom profile disables caching for admin or POST routes.
Impact: Response time cut by ≈ 50 %.
6. Reducing Frontend Payload
- Convert images → WebP (+ lazy-load)
- Preload fonts to remove FOUT
- Use Vite minification + vendor splitting
JS Bundle: 890 KB → 285 KB (–68 %) LCP Improvement: ≈ –200 ms.
7. Deployment & Maintenance
Deploy Script
git pull origin main
composer install --no-dev --optimize-autoloader
php artisan migrate --force
php artisan optimize:clear && php artisan responsecache:clear
php artisan optimize
npm ci && npm run build
sudo service php8.3-fpm reload
php artisan cache:warmup
Scheduled Tasks
$schedule->command('cache:warmup')->everySixHours();
$schedule->command('session:gc')->weekly();
8. Real Results
| Page | Before | After | Gain |
|---|---|---|---|
| Blog Index | 250 ms | 98 ms | 61 % |
| Homepage | 323 ms | 150 ms | 40 % |
| Freelance Services | 400 ms | 180 ms | 55 % |
| Product Detail | 510 ms | 185 ms | 64 % |
| Metric | Before | After | |
|---|---|---|---|
| Queries / page | 120 + | 15–40 | –85 % |
| Total Page Size | 4.8 MB | 1.2 MB | –75 % |
| Fully Loaded Time | 6.2 s | 1.8 s | –71 % |
Lighthouse Scores
| Before | After | |
|---|---|---|
| Performance | 42 | 94 |
| Accessibility | 87 | 95 |
| Best Practices | 79 | 92 |
| SEO | 91 | 100 |
9. Key Lessons Learned
What Worked Best
- Eager-loading to eliminate N + 1 queries
- Response cache for repeat traffic
- DB indexes for frequent lookups
- OPcache for execution speed
- Asset minification & lazy loading
Mistakes to Avoid
- Don’t cache authenticated pages
- Always clear caches post-deploy
- Don’t optimize blindly — measure first
- Warm critical caches after deployment
Monitoring Checklist
✅ Laravel Telescope (staging) ✅ Debugbar (local) ✅ Monthly Lighthouse audit ✅ < 30 queries per page ✅ Track cache hit rate ✅ GTmetrix load time trend
Conclusion
Optimizing Laravel on shared hosting is absolutely possible.
Key actions:
- Profile first, then prioritize fixes
- Cache everything that can be cached
- Eliminate N + 1 queries and add indexes
- Minify assets and compress delivery
- Automate deploy + cache warming
With methodical tuning, even modest hosting can deliver sub-200 ms responses and near-perfect Lighthouse scores.
Further Reading
- Laravel Performance Optimization Docs
- Spatie Response Cache Package
- Laravel Query Optimization Guide
Conclusion
Optimizing Laravel applications on shared hosting is challenging — but achievable with the right strategy.
If you’d like expert help improving your app’s speed, caching, and scalability,
you can hire me on Fiverr for professional Laravel and WordPress optimization services.
All results and examples in this article are from a real Laravel 11 production environment optimized by our engineering team.
The Order of Operations That Matters
Cache config, routes, and views first — php artisan config:cache route:cache view:cache — because those wins are free. Then attack Composer with --optimize-autoloader --no-dev, which trims class-map lookups measurably on constrained CPUs. Only after those land should you touch OPcache settings, because host-level overrides vary wildly on shared plans. Measured on a typical shared account, that sequence alone moved our time-to-first-byte from the high 800s to the low 300s in milliseconds — before any application-level tuning.
Reading the Numbers Like an Engineer
Benchmarks on shared hosting lie unless you control for noisy neighbors. Measure at three different times of day, take medians rather than averages, and always test the same route with the same payload. A single spectacular reading after a tweak usually means the server was quiet, not that your change worked. We kept a plain spreadsheet: date, change made, median TTFB over ten requests, and a note on server load. That discipline caught two "optimizations" that did nothing and one that made things worse — the full-page cache initially served stale CSRF tokens and broke the contact form until we excluded form routes from it.
The other habit worth stealing: change one thing at a time. Shared hosting environments have enough variables already — PHP version, neighbor load, disk contention — that stacking three optimizations in one deploy makes it impossible to know which one mattered. Slow is smooth here; each isolated change took ten minutes to verify and built a playbook we now reuse on every client project.
When Optimization Stops Being Worth It
There's a floor on shared hosting, and you'll feel it. Once framework caches are on, autoloading is optimized, OPcache is confirmed active, and your queries are indexed, further effort buys single-digit milliseconds. If your traffic justifies more, the upgrade path is a small VPS — the same Laravel app that plateaued around 300ms TTFB on shared hosting dropped under 100ms on a modest virtual server with no code changes at all. The economics matter: hours spent squeezing a shared plan often cost more than a year of the better tier.
Before you migrate, though, exhaust the free wins — many "slow Laravel" complaints on shared hosting turn out to be a missing OPcache, an unindexed foreign key, or session storage hitting a slow disk. The checklist in this guide fixes the majority of them in an afternoon, and everything it configures carries over unchanged when you eventually move to bigger infrastructure. Optimization on constrained hardware is also the best training ground there is: habits formed where every millisecond is visible pay off forever on servers where waste hides more easily.
The One-Afternoon Action Plan
If you only have a few hours, run this order: confirm OPcache is actually enabled with a phpinfo check, cache config and routes, switch sessions and cache to the database driver, add indexes to any column that appears in a where clause on your busiest pages, and turn on response caching for anonymous traffic only. Measure before and after each step with the same route and record the medians. Most Laravel apps on shared hosting see their largest single jump from the OPcache confirmation alone — it is disabled or misconfigured on more shared plans than anyone admits — and the whole sequence needs no budget, no migration, and no downtime. Ship it this week and keep the measurements — they become your baseline for every future decision.
The Ceiling and When You Hit It
Optimize Laravel shared hosting far enough and the next bottleneck is the host itself — when cache hits still lag, that's your signal to move tiers, not tweak more. My queues on a VPS and Laravel 13 guide go deeper.
If you want your Laravel app tuned for cheap hosting, that's something I do through Ramlit.