Laravel Nightwatch Setup Guide: Pro Monitoring
1. Introduction
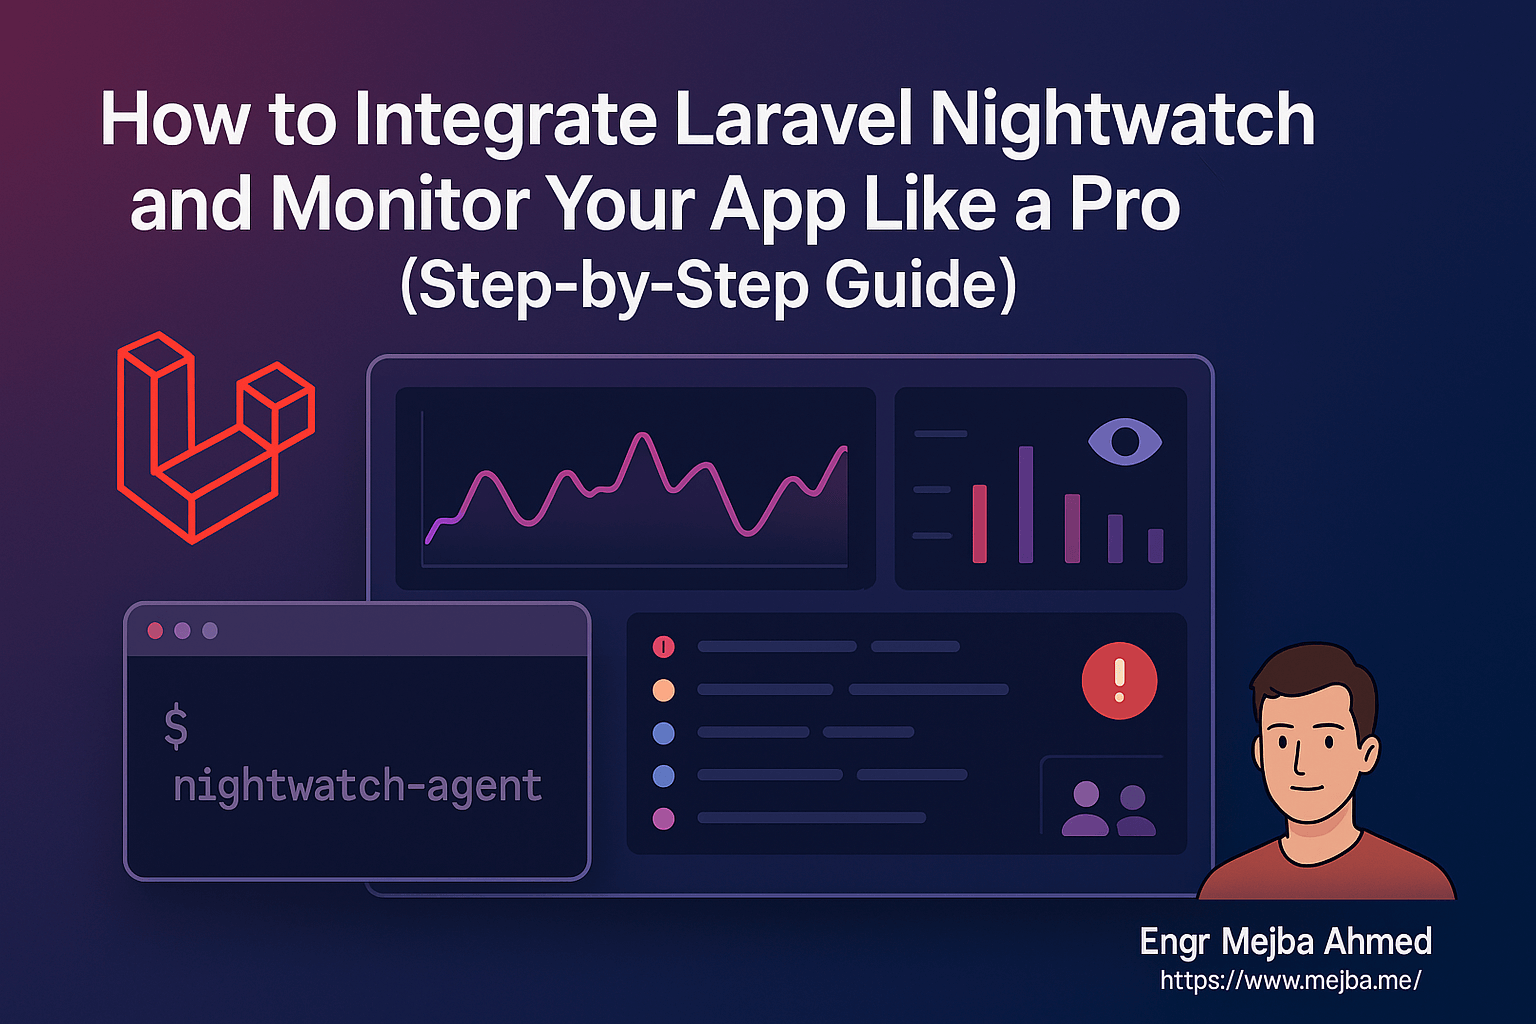
In the modern Laravel development workflow, monitoring and observability are essential for ensuring smooth user experiences and catching issues early. Laravel Nightwatch is a new, official monitoring tool built specifically for Laravel applications. It provides deep visibility into your app's performance, errors, requests, jobs, and more—all from a beautiful, developer-first dashboard.
In this guide, you'll learn how to integrate Laravel Nightwatch into your Laravel application, step by step. Whether you're building a solo project or managing production-grade infrastructure, Nightwatch will help you monitor like a pro.
2. What is Laravel Nightwatch?
Laravel Nightwatch is an official SaaS tool from the Laravel ecosystem designed to help you monitor application-level metrics in real-time. It provides:
- Exception tracking (handled & unhandled)
- Request performance stats
- Queue job metrics
- Real-time user activity
- Seamless Laravel integration
Think of it as Forge + Telescope + Sentry rolled into one, but purpose-built for Laravel.
3. Prerequisites
Before you begin, ensure the following:
Requirements
- Laravel 10 or later
- Composer 2+
- PHP 8.1+
- An account on nightwatch.laravel.com
Important: Laravel Nightwatch is not compatible with shared hosting environments like Hostinger. You should use a local environment or a VPS (e.g., Laravel Forge, DigitalOcean, etc.).
4. Integration Steps
Step 1: Install Laravel Nightwatch
Run the following from your project root:
composer require laravel/nightwatch
If your Composer version is outdated (e.g., v1.x), upgrade it first:
composer self-update --2
Step 2: Add the Token to .env
After creating a new app in the Nightwatch dashboard, you'll receive a token:
NIGHTWATCH_TOKEN=your-nightwatch-token-here
LOG_CHANNEL=nightwatch
Step 3: Start the Agent
To start sending data:
php artisan nightwatch:agent
You should see:
[INFO] Nightwatch agent initiated: Listening on 127.0.0.1:2407
[INFO] Ingest successful
Step 4: Trigger Activity
Visit routes, trigger exceptions, or queue jobs to see real-time data appear in the dashboard.
5. Monitoring Best Practices
- Run Agent in Background: Use Supervisor or systemd to keep the agent running in production.
- Use
stackLog Channel: To log to both Nightwatch and default Laravel logs:
LOG_CHANNEL=stack
Update config/logging.php:
'channels' => [
  'stack' => [
    'driver' => 'stack',
    'channels' => ['daily', 'nightwatch'],
  ],
  'nightwatch' => [
    'driver' => 'monolog',
    'handler' => \Laravel\Nightwatch\Log\NightwatchHandler::class,
  ],
],
6. Pro Tips
- ✅ Use Laravel Forge or a VPS to run Nightwatch agent persistently
- 🔄 Automate test/agent start via deployment hooks
- 🧪 Combine with Laravel's feature tests for full-stack observability
- 🔐 Never commit
.envwith token to public repos
7. Conclusion
Laravel Nightwatch brings powerful, first-class observability directly to your Laravel projects. With minimal setup, you gain visibility into the health of your application—without needing third-party error tracking or logging systems.
Start monitoring like a pro today. Your future debugging self will thank you.
Tuning the Signal-to-Noise Ratio
A fresh monitoring install alerts on everything, and everything is the same as nothing. Spend the first week tightening: route only genuinely actionable events to channels humans watch, batch the informational stream into a daily digest, and delete any alert nobody acted on twice. The discipline is stern but simple — every alert should complete the sentence "when this fires, someone should immediately…". If you can't finish the sentence, it's a metric for the dashboard, not an alert for a phone. Teams that skip this pruning phase end up with muted channels and miss the one alert that mattered.
The Metrics That Predict Trouble
Response time percentiles beat averages — watch the p95, because averages hide the slow requests your unhappiest users actually experience. Queue depth and failed-job counts are early smoke for background processing problems; a queue that's growing is a promise being broken quietly. Watch scheduled task duration too: crons that creep from seconds toward their interval eventually overlap, and overlapping crons produce the strangest bugs in Laravel. None of these need dashboards you stare at — they need thresholds that speak up when crossed, which is exactly what you've now built.
Making Monitoring Part of the Workflow
The install finishes the setup; the habit finishes the job. Check the dashboard at deploy time — every release should show flat-or-better curves within the hour, and a regression caught while the diff is fresh takes minutes to attribute instead of days. Once a month, skim the slowest endpoints list and pick one to improve; monitoring that only prevents disasters is leaving half its value unclaimed. The quiet endgame is culture: when "what does Nightwatch say?" becomes the first question in every incident and every optimization debate, the tool has done its real work.
Alert Fatigue Is the Real Enemy
Every monitoring rollout dies the same death if you let it: alerts multiply, humans mute, incidents sneak past muted channels. Defend ruthlessly — one in-hours channel for act-now, one digest for awareness, nothing else. The kill criterion is usage: any alert ignored twice gets demoted to the digest or deleted. A monitoring system people trust at 3 AM is small, curated, and boring — exactly as designed.
Starting Smaller Than Feels Professional
If full observability feels heavy for your app's stage, start with two alerts only: error rate spike and response time p95 breach. Those two catch the majority of user-facing incidents, and you can grow into queue metrics and cron monitoring as the app earns complexity. Monitoring should scale with consequences — a side project with three users needs a smoke detector, not a control room.
The Bottom Line
Nightwatch's value compresses to one sentence: you find out from your dashboard instead of from your users. Everything above — installation, tuning, the alert diet, the review habits — serves that sentence. Set it up this week; the first incident it catches early pays for every minute.
Monitoring That Earns Its Keep
This Laravel Nightwatch setup guide ends where monitoring begins: alerts tuned so every notification means action. An alarm nobody reacts to is noise with a dashboard. My slow query logging and automated deploys go deeper.
If you want observability set up for your app, that's work I take on through Ramlit.